
I Used Claude Code to Debug a Nightmare
Here's What I Learned

The fix was three words. The investigation? 1,427 lines across four days, chasing 63 suspicious database connections when only 10 mattered.
I recently debugged a bug that brought my entire application to its knees. What I learned about AI-assisted debugging turned out to be more valuable than the fix itself.
I’ll get technical in places (it’s unavoidable given the nature of the bug), but the broader lessons about AI-assisted debugging apply whether you’re writing code or not.
TL;DR
What I learned:
Why async/sync boundaries are debugging nightmares
How to structure AI-assisted investigations
When human intuition beats AI exhaustiveness
Why documentation is your debugging superpower
For the curious: You can find the full investigation and lessons learned technical documentation here.
The Setup
I’m building a product that streams AI responses to users—think ChatGPT’s typing effect. This requires server-sent events (SSEs) because LLMs take seconds to generate responses, and nobody wants to stare at a blank screen. I also designed my architecture around SSEs because I expected all kinds of events being sent; some events would be based on user input, and some would not.
I used Django because I know it well, it has spectacular documentation and powerful database functionality. Because of the nature of this architecture, I decided to be async-first; this would allow efficient scaling and resource usage.
Async I/O (async) is like having a single waiter managing multiple tables instead of one waiter per table standing around waiting for each customer to finish chewing.
Traditional (synchronous) I/O:
Your program asks for data → sits idle waiting → gets the data → continues
Like calling someone and staying on hold until they answer. Your entire program is blocked.
Async I/O:
Your program asks for data → immediately moves on to other work → gets notified when data arrives → handles it
Async I/O lets your app handle way more users and requests simultaneously without buying more servers. It’s the difference between a web server handling 10,000 concurrent users versus 100 with the same hardware.
However, async support within Django and broadly within Python is relatively new, given the maturity and age of both projects1. Async Python was introduced in 2015, and Django added preliminary async support in 2019 (Python’s been around since 1991 and Django since 2005).
There are libraries and projects that are async-first, but the overall ecosystem is bifurcated into synchronous libraries and asynchronous libraries. This was the crux of the problem2: throughout my stack, some components were asynchronous and some were not leading to inexplicable hangs in the interface.
When Everything Froze
Click around too fast and the entire app would freeze. No requests could get through. Only fix? Restart the server. This also did not represent a ton of requests, and it caused concern. While I reproduced the issue by clicking around quickly, my intuition was that this would occur when even a handful of users used the app concurrently. This was the opposite of what I wanted! The whole point of the async-first architecture was supporting many concurrent users efficiently. And the only resolution was restarting the web server.
I knew it was related to async because of the nature of the stack; many components were unproven in an async environment. However, it was unclear where to start. Was it the database? Was it the API serializers? Was it thread pool exhaustion? It was time to debug and find out.

The Investigation Strategy
I started where any reasonable engineer would: the obvious culprits. Database configuration? Check. Thread pool exhaustion? Nope. When these quick wins didn’t pan out, I knew I was in for a proper debugging session. I’d dealt with concurrency bugs before - they’re the software equivalent of trying to catch smoke.
Here’s where it gets interesting: I was already using Claude Code for development, so why not use it for debugging too? But I didn’t just throw the problem at it and hope for magic. I structured the process the same way I would tackle it manually.
Every hypothesis, every test, every outcome got documented in real-time. Think of it as leaving breadcrumbs, except instead of getting eaten by birds, these breadcrumbs would actually help Claude (and future-me) understand what we’d already tried.
The workflow: I’d direct Claude to investigate specific areas. It would run tests, document findings, and I’d steer toward the next hypothesis. I ran it in maximal thinking mode because this wasn’t straightforward—it was a deep integration issue between async and sync components that required careful reasoning.
The real engineering challenge became creating a faster feedback loop. The original bug took several clicks and some waiting to manifest. That’s brutal when you’re testing multiple hypotheses. So part of the process was figuring out how to make the bug appear faster and more reliably. The quicker I could reproduce it, the quicker I could validate whether a fix actually worked.
This hybrid approach - AI doing the grunt work while I provided direction and manual verification - turned what could have been weeks of solo debugging into a more systematic investigation. Claude couldn’t replace my intuition about where to look next, but it could exhaustively check those places and document everything along the way.
Timeline
Here’s how several days of investigation actually played out:
Day 1: The Obvious Suspects
Started with the most likely culprits. First thought: maybe the system was running out of worker threads (think of these like employees handling customer requests). Bumped the limit from 10 to 100. The hang still occurred with only 4 threads busy. Definitely not that.
Next theory: maybe the database was holding onto information too long during user sessions. Disabled that feature. Still hung.
Then I tried something drastic - completely disabled the streaming connections that let users see updates in real-time. If those were the problem, this should fix it. It didn’t. The app still hung even on normal page loads. So much for the easy wins.
Day 2: The Convincing Red Herring
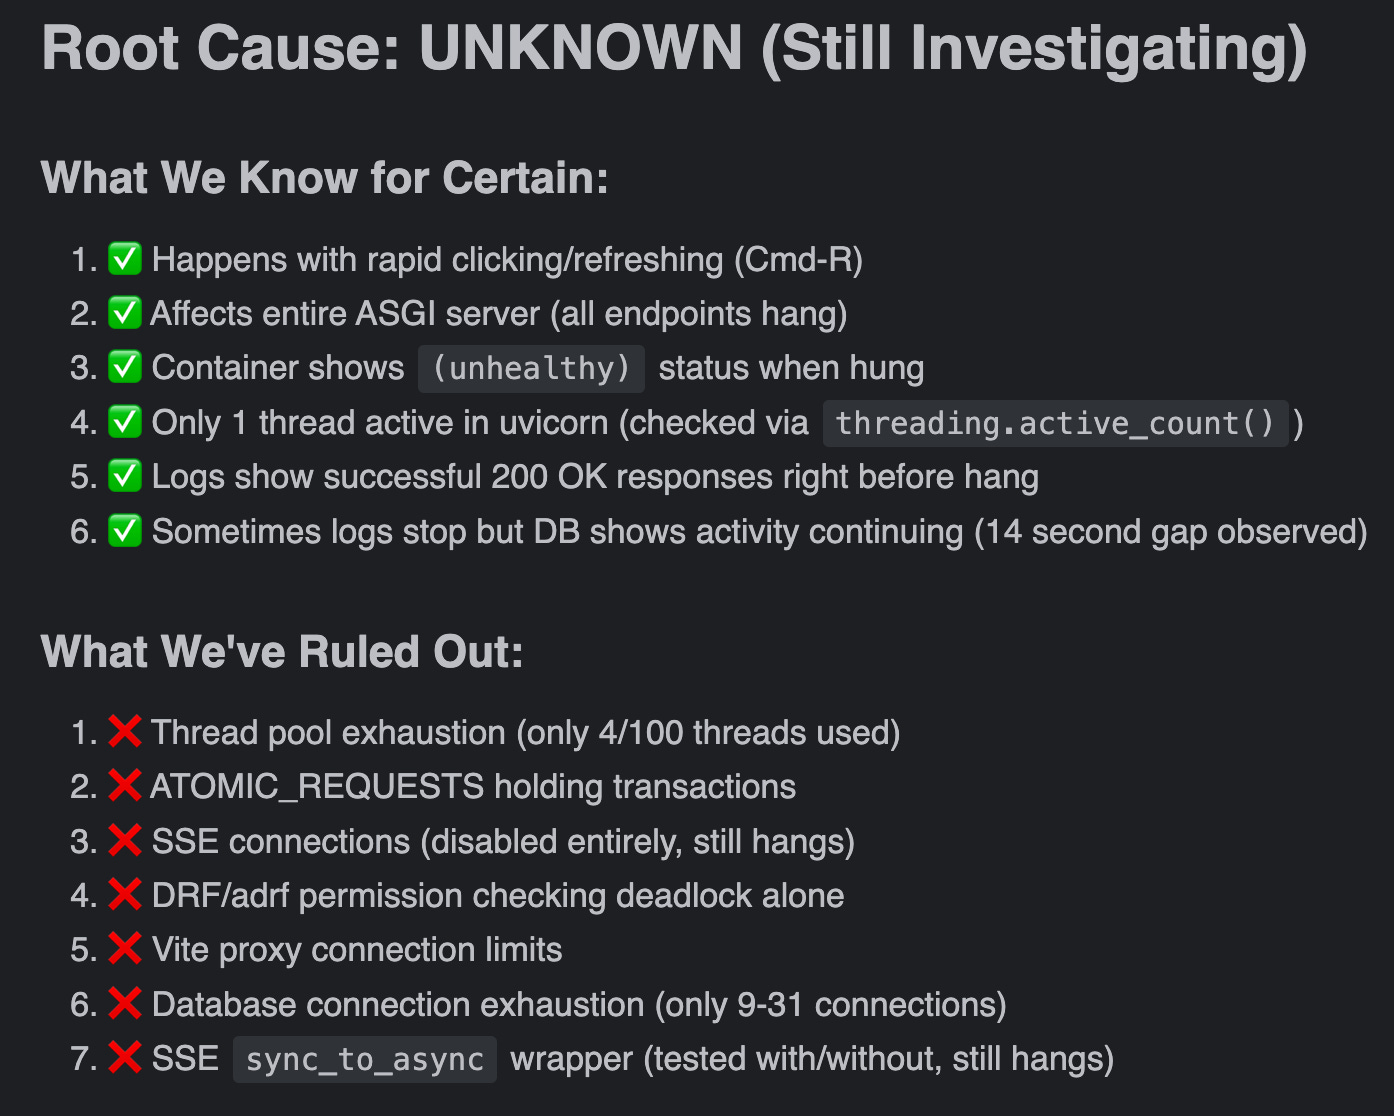
Checked the database during a hang and saw 63 idle connections just sitting there, all from the same security check. This looked damning - like leaving 63 phone lines open instead of hanging up. This has to be it.
Made a change to force the system to hang up after every call instead of keeping lines open. The app worked! Problem solved, right?
Wrong. During the next hang, I checked again: only 9 connections. Then 31 during another test. The database could handle 100 connections easily. This wasn’t about too many connections at all - it just happened to look that way during my first check.

Day 3: The Grind
Tried everything: different security checking approaches, adjusting how the development proxy handled requests, various configurations for managing the async/sync boundary. None worked.
Set up better monitoring tools to watch what was happening in real-time. Claude Code documented each attempt systematically. The investigation file grew longer with each dead end.
Day 4: Finding the Smoking Gun
Decided to test a wild theory: what if I just skipped the security check entirely in the streaming manager? Just let everyone through temporarily to see what happens.
Started rapidly clicking between conversations in the app. Connection count stayed at 3. No hang. No errors. Perfect performance.
Found it. The security check at the start of each stream was grabbing a database connection and never letting go - not for the quick moment it needed, but for the entire time the stream stayed open (potentially minutes or hours). When I rapidly switched between 10 conversations, each stream grabbed its own connection and held it. After 10 switches, all available connections were taken. Request number 11 had to wait, timing out after 10 seconds.
The confusing part? Only 10 connections were actually held, not 63. But those 10 connections were enough to exhaust the pool when they never got released.
The Fix
Added a wrapper function that forces the database connection to close immediately after the security check completes, rather than keeping it open for the stream’s lifetime.
The change: three words added to one line of code.
The investigation: 1,427 lines of documentation across four days.
That’s debugging.
Where AI Falls Short
Claude struggled with distinguishing root causes from legitimate issues. Claude can’t distinguish between “not the problem” and “not a problem.” It marked legitimate bugs as resolved simply because they didn’t explain the hang. I had to circle back manually to fix these issues later.
This speaks to a broader limitation: LLMs can’t maintain a nuanced “mental model” where something can be simultaneously “not the root cause” and “still needs fixing.”
Temporal reasoning remains a weak spot. Claude’s sense of time is consistently off. The investigation documents suggest this took weeks, but it actually took days. This mirrors temporal issues I’ve noticed elsewhere: when planning projects, Claude thinks everything will take weeks. When doing AI-powered research, models struggle with understanding that one source supersedes another simply because it’s more recent. The temporal confusion was most apparent in the “lessons learned” document Claude generated after reading the full investigation - it assumed the ordeal spanned weeks rather than days, presumably because the depth of investigation felt like it should take that long.
Documentation accuracy was directionally right but not always precise. The overall narrative held up, though not everything Claude documented matched exactly what happened. The core issue is how it handles granularity and structure: Claude didn’t quite grasp that hypotheses and solutions are independent “atoms” of investigation. Instead, it treated the entire documentation as one continuous stream, making it harder to distinguish between what we tried, when we tried it, and what we learned from it.
I still had to direct the investigation. Despite Claude’s ability to run tests and document findings, I needed to point it toward the right logs, suggest which areas to investigate next, and make judgment calls about what mattered. It’s like having a brilliant research assistant who can exhaustively check everything you point them to, but can’t quite develop investigative intuition on their own.
Manual reproduction was unavoidable. The debugging process was deeply manual. I had to physically click through the app to trigger the hang, over and over. In the future, I’d love to try something like a Playwright MCP or similar automation to let Claude drive the debugging process itself. But UI automation is notoriously flaky - anyone who’s maintained Selenium tests knows the pain. Perhaps tools like Stagehand, which are AI-native, could help bridge this gap. Until then, the human remains an essential component of the debugging loop.
What This Taught Me About AI-Assisted Development
Context engineering is the difference between a helpful assistant and an expensive parrot. When Claude had good documentation to work from, it could build on previous findings and make useful inferences about where to look next. This is where AI coding agents shine - their uniform ability to reference specific artifacts (@my_file) is crucial. I wish this function laity existed outside of coding assistants. I had Claude document learnings separately and more concisely so they could serve as future reference and best practices. These findings echo the context stack I described earlier this year. Organizing context isn’t glamorous, but neither is debugging. Both require the same discipline.
Human-in-the-loop isn’t a bug, it’s a feature Similar to my learnings with Atticus, current AI technology is too early to be completely autonomous. What worked really well in this workflow was being able to redirect Claude when I saw it going down the wrong path. This is why Claude Code currently has the best coding agent experience: it uses tools I use, in my development environment, and I can supervise and jump in when needed. This design philosophy becomes striking when comparing against other AI coding agents that try to do everything autonomously and end up doing nothing useful.
Artifacts are the infrastructure layer of AI debugging. In this case: code Claude could run, and documentation it could reference. Without easy access to these artifacts, Claude would be left guessing about what’s been tried and how to verify changes. The ability to create, reference, and modify concrete artifacts transforms an AI from a chatbot into a genuine debugging partner.
The broader lesson? AI assistance works best when you treat it like a skilled junior developer who’s really good at following instructions and running experiments, but needs you to provide the investigative intuition and strategic direction.
Funny enough, Python 3.14 (released after this debugging saga) includes improvements specifically for debugging async tasks. Would’ve saved me some pain.
If you’ve read “What color is your function?“ you know mixing async and sync is dangerous. This was my most direct contact with that danger.
Thanks for writing this, it clarifies a lot; what if an async boundary issue appeared in a purely syncronous system, would AI still pinpoint it so fast?